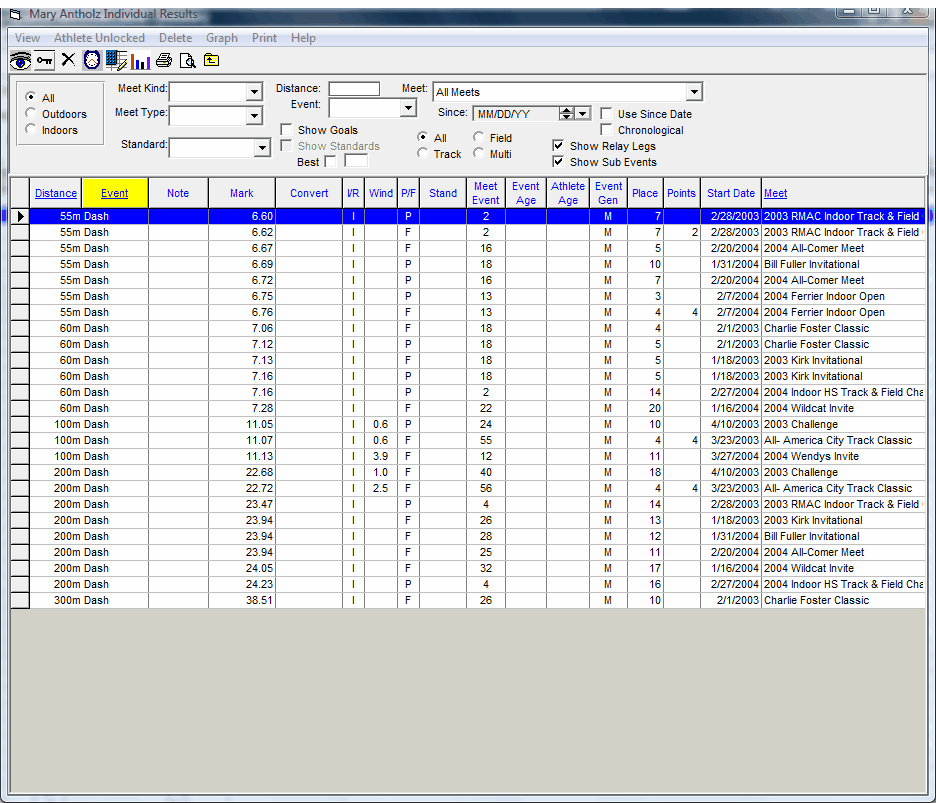
The Athlete Results Browser is a powerful tool for reviewing and analyzing meet results, performance patterns,and Graphs for an individual athlete. Click on Athlete from the Main Menu Bar and then click on Results or the Results icon and TFTM will display a split screen - pick an athlete from the left side and TFTM will display that athlete's results on the right side of the screen.

The default sort for this browser is distance, event, and best mark, but you can also click on the chronological check box to sort the marks based on the date that they were achieved.
To view the splits for any result, highlight the meet result for which you want to view splits, and either right mouse click or click on the Enter Splits icon on the top of the browser. In the box, type in the number of splits needed, then click the button Set Number of Splits, and TFTM will create the number of columns you need.
Click on the Time Calculator on the Results Browser menu Bar, and TFTM will display a calculator tool to help you calculate both running and subtractive splits.
Click on the Show Relay Legs check box and TFTM will list the Relay Legs that you have previously saved for that athlete. They are indicated with an "S" and highlighted in green.
Click on the Show Goals check box and TFTM will also include any Goals that have been previously set up from the Athlete Browser for that athlete.
Click on the Show Sub Events and TFTM will show all the sub events for any multi-events that this athlete has competed in.
Filtering Information
TFTM offers a very extensive list of Meet Results filtering options. For example, you might want the Athlete Result list to be tagged with the appropriate Mark Standards or filtered by a specific Meet, Meet Kind, Meet Type, or Event or Distance. Make your Athlete Results filter choices, and TFTM will display the results as you have requested.
| • | Specific Meet, Meet Kind, Meet Type, Meet Since Date, Track, Field, or Multi Event |
| • | Best mark or best "x" marks for each event/distance |
| • | Specific event and/or distance |
Graph Results Option
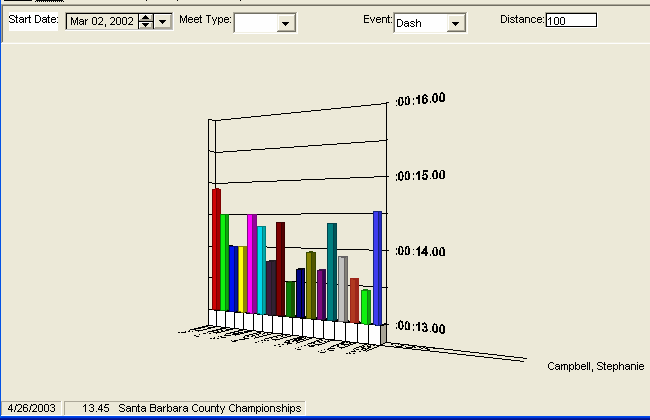
This Report is designed to graphically display an athlete's performance over time for a particular event. Each graph includes one athlete at a time. Before you display a graph for a particular athlete, pick a specific event and distance at the top part of the Results Browser. Then click on Graph or the Graph icon on the Results Browser Menu Bar, and TFTM will then proceed to graph the athletes marks based on the performance criteria you have selected. You can also filter the marks that you wish to graph right from the Graph display screen by:
| • | Start Date |
| • | Meet Type |
| • | Event |
| • | Distance |

After you have made a filter or format change, you must click on the Graph Results icon to tell TFTM to redraw the graph based on your changes.
A Metric/English choice is available to the Graph feature for field events, provided you have the System Preferences set to display converted marks for field events.
Click on the Line Graph icon, the Bar Graph icon, and/or the 2D and 3D icons to format the graph as you desire. You can rotate the graph by clicking on one of the four directional arrows. You can customize your graph by portioning the actual graph, legend, and title anywhere you want on your computer screen by clicking and dragging the graphic item. You can also resize any of the graphics on your screen by clicking on the graphic and dragging the side bars to the position you desire.
If you have chosen Show Goals on the Results Browser, when you click on Graph, the Goad for this Athlete for the specific event you chose will also be shown.
Click on Print or on the Print icon and TFTM will print the current graph on your default printer. You can customize how you want the graph to print by portioning the actual information as discussed above.
Print Athlete Performance Report
Click on Print or the Print icon and TFTM will print a Performance Report for this specific athlete based on the performance filters you selected above including Best Marks, Splits, DQs and NSs.